
In a recent ProBlogger Mastermind, I shared a slide that seemed to hit a nerve with the group.
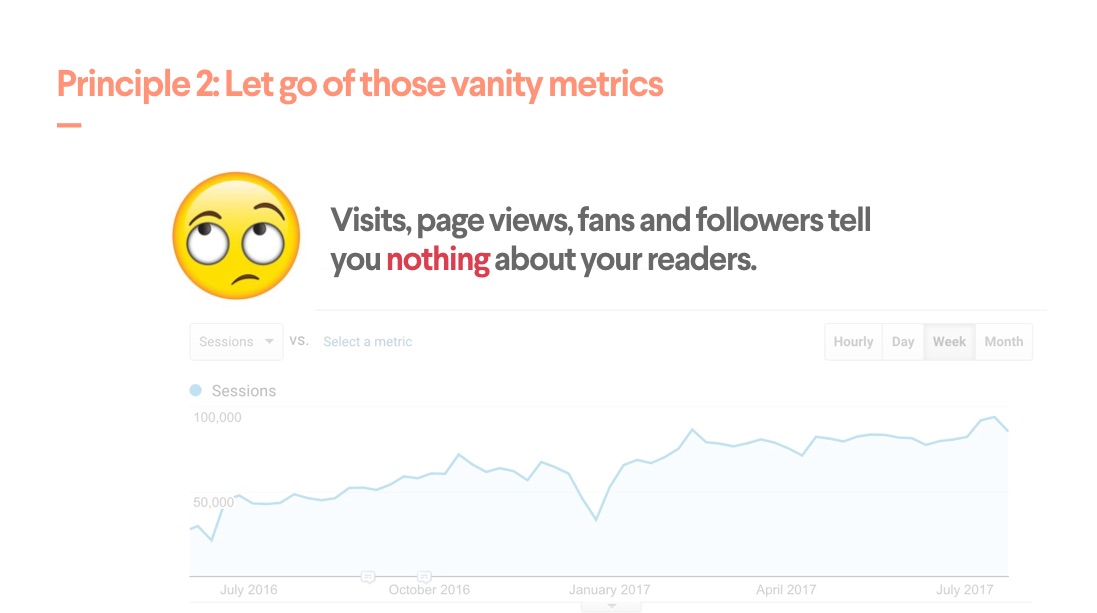
While having lots of page views, sessions, fans, followers and even email subscribers may feel good, they don’t actually tell you anything about the health of your blog.
I included this in my Mastermind session after having several conversations with bloggers that all started something like this: “Traffic is growing, and so is my social following and email list. But I’m not making any money”.
For many, the monetization emptiness came from focusing on certain results and metrics (such as those I just mentioned) that sounded great, but had very little bearing on actual monetary return.
Vanity over actionable metrics isn’t a new thing.
The idea of measuring the metrics that matter has been around for a while. People like Neil Patel have made their names and built successful companies through challenging us to think more deeply about the ‘Why?’ behind our numbers. Today, action-driven data is available to everyone doing business online – including bloggers – so there’s no excuse for not using it.
But rather than leaping into the depth of data, I recommend you begin with small steps.
Define your North Star Metric, and what might influence it
Time is the enemy of most bloggers just starting out, and so focus is critical. A North Star Metric gives you one thing to care about above everything else.
“To uncover your North Star Metric you must understand the value your most loyal customers get from using your product. Then you should try to quantify this value in a single metric.” – Sean Ellis
Your North Star Metric should be a metric that will directly improve the health and prosperity of your blog.
Start asking better questions
It’s time to start ignoring what Google Analytics thinks you want to know. Instead, think about the real value you’re trying to give a reader (your North Star), and what observable actions they might take that will show how good a job you’re doing getting them there.
For example, if your blog teaches others how to run a successful blog, what short- and long-term behaviors would you expect to see from someone you’re actually teaching?
They could be basic things such as:
- Find you (first time visit)
- Come back again (repeat visit)
- Engage (comment on a post, or follow you on a social platform)
- Give you their email address (subscribe)
- Buy or subscribe to a product (purchase)
- Buy or subscribe to a second product (purchase again)
Thanks to free services such as Google Analytics, we take comfort in very basic but often misleading blog metrics. After all, who has the time (or the energy) to dive into the numbers? But if think about the questions you need to answer before you start worrying about how to measure them, you’ll quickly change your mindset.
And once you’ve got this down, you’ll be ready to get your numerical nerd on.
Understanding cohorts and segmentation
Statistics and mathematics are probably the last things you want me to talk about. But segmentation and cohorts are important terms that you need to understand.
So what are they?
Segmentation and cohorts are techniques used to collate data into meaningful groups. They let you compare different groups in various ways, as well as over different time periods, and ask questions like, “Are my current first-time visitors behaving differently from the first-time visitors I had a year ago?”
While Google Analytics lets you do some basic cohorts, you’ll quickly find the level of detail Google gives you for free quite limiting.
But when you look at your data through cohorts and segmentation, you can identify specific strengths and opportunities to improve.
What is a cohort?
In statistics, marketing and demography, a cohort is a group of subjects who share a defining characteristic.
For example, you might notice over time that people who find your blog through search are less inclined to arrive at your North Star than someone coming from a different source. By using research, data, and experimentation you can get a better understanding of the situation, and create a plan to improve the experience of these first-time SEO arrivals.
For example, you may need to:
- create a stronger CTA in your post to help casual SEO arrivals learn more about you
- find better ways to get readers to check out a second post, or give you their email address
- spend time building more traffic from those lower volume but higher value-per-visitor channels.
Whatever the answer is, you’ll find it in your experiments and metrics.
And from there you can look at your most recent cohorts to see what impact your new approach is having.
Congratulations. You’re now taking meaningful steps to grow the prosperity of your blog.
The theories are nice, but what about in practice?
At 99designs, we began reflecting on our blog’s performance by asking deeper questions about the impact we were having on our readers.
Some of the results were hard to read.
Do people read our content?
We knew how many people started reading our content. But we had no idea if they were consuming all those wonderful words we’d put so much effort in creating. We could make some guesstimates based on ‘time on site,’ but that was too general. So we produced two reports – time engaged with the page, and how far people were scrolling down the page.
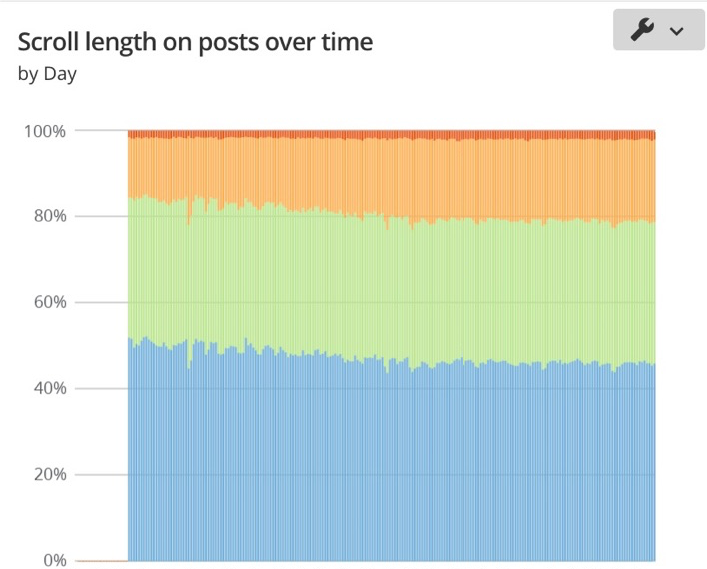
The results were hard to read at first. “What do you mean, ‘Only 5% get to the end’?” But with visibility, we’ve managed to improve this percentage significantly in the past year.
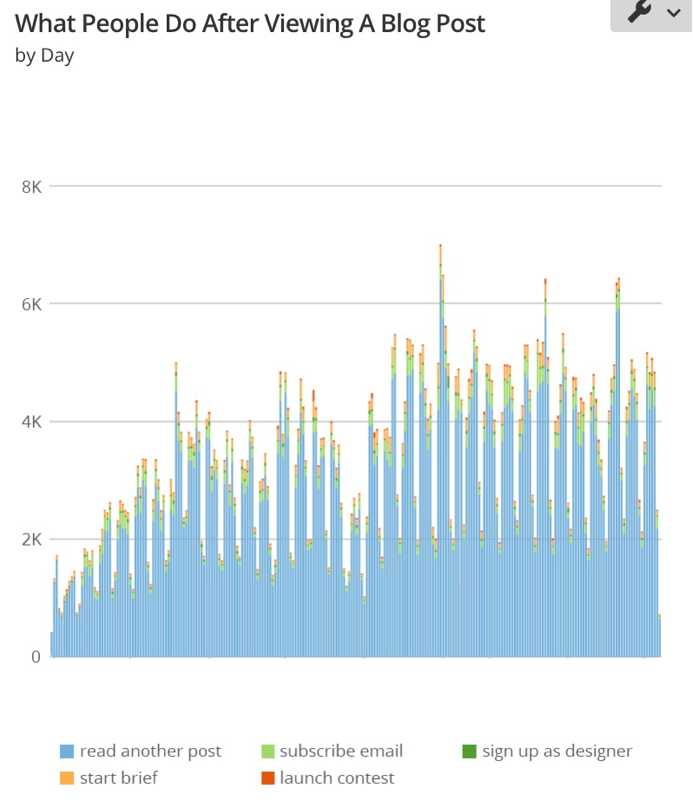
What do people do after they finish reading (or abandon) a post?
We’d tried cobbling together an answer using sign-up rates and other things such as page views per user. But those were meaningless aggregate results.
So we created a report on what people do after reading (or not reading) a post.
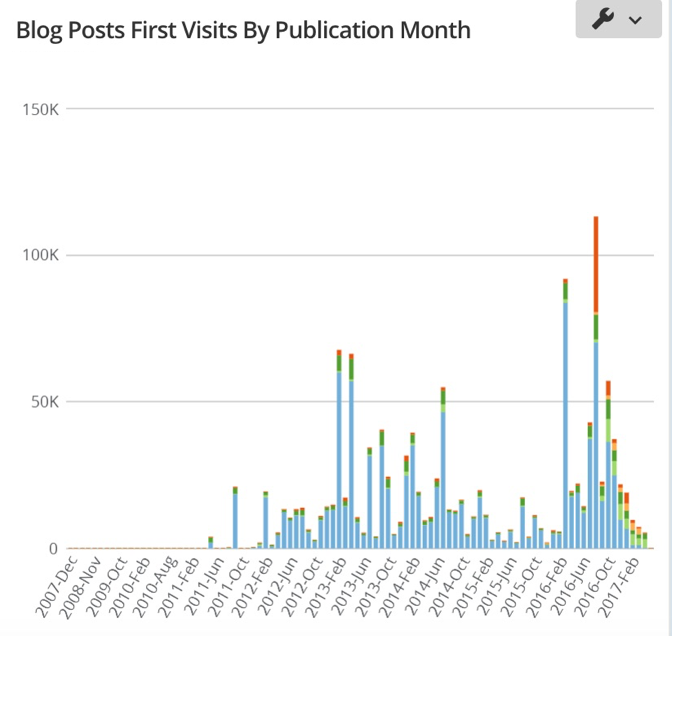
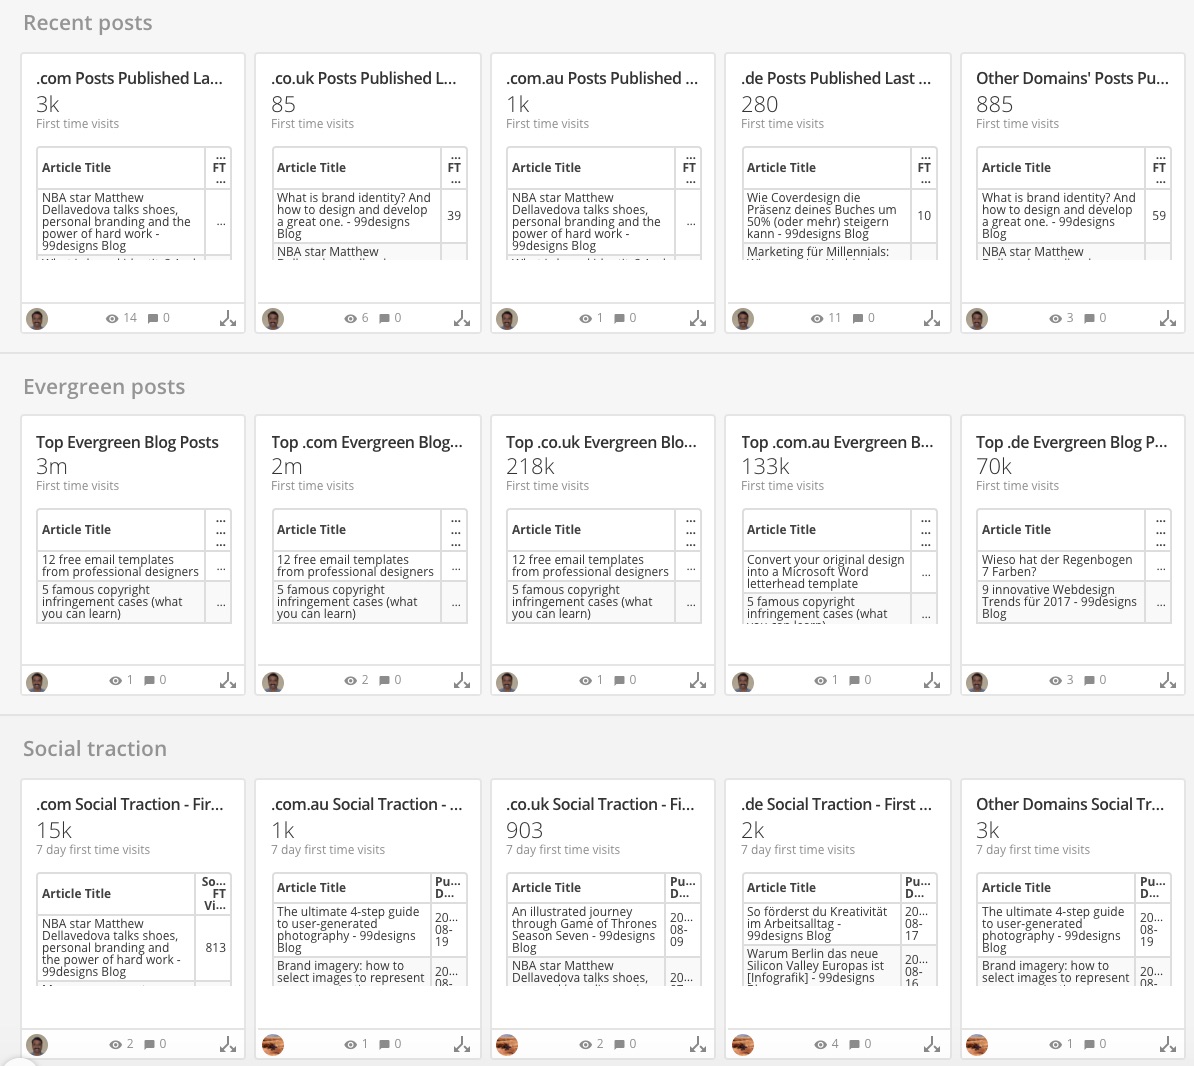
What’s driving growth – our old (evergreen) content or our new content?
We assumed our new content was fueling growth. But it was actually a combination of the two.
But wait, there’s more
These graphs are interesting. But when you start to segment things become more insightful. We can look at this graph by channel, post category, author and more to find patterns in what’s being read and what’s providing value to our readers. These insights are now intrinsic to our growth plans for our blog.
Upping the ante for key transitional pages
Our blog is what we call a top-of-funnel page type – one that’s consumed early in a relationship we hope to build with our readers.
As people progress through our funnel, we’ve identified key transitional pages that signal a significant potential shift in the relationship from reader to customer.
One example is our logo design page.

On this page, a reader or visitor is deciding whether to pursue getting a logo with us — an obvious turning point. While we have great tracking measures on our blog, we track ten times as many events on our logo design page to learn even more about our transitional pages. And we use this extensive data to continually improve the page with changes both large and small.
The dangers of misinterpretation
I’ve been fortunate to work closely with some brilliant people who see numbers in a way I sometimes struggle to comprehend. And there have been some less than inspiring moments where I’ve been shown how quite clearly how ‘wrong’ I’m interpreting the data — publicly and privately.
As you get access to more data and learn how to use it, you’ll undoubtedly face the same challenge. While you may be tempted to scurry back to a comforting world of vanity metrics and intuition, try looking your data critics in the eye and asking them to help you do better. Chances are your first blog post wasn’t very good. Why would your first analytical endeavor be any different?
That said, here’s how to avoid some of the mistakes I’ve made:
1. Become a student of data interpretation
There are a lot of resources, books and courses that can be really helpful. I’m currently doing a Data Science course on the very subject to help me lift my analytical game.
General Assembly, Skillshare, Udemy, Lynda and Udacity all have data- and analytics-related courses you can subscribe to.
2. Don’t go it alone
Collaborating with someone on your analysis — even if it’s just talking through your data and what you’ve learned — helps you find not only mistakes in your logic, but also any subconscious biases that may have crept into your analysis.
3. Find your devil’s advocate
This one is hard, but super important. Find and work with someone who will tell you you’re wrong more often than right. The secret to making the most of this critical view on your decisions is learning when to listen to them and when to ignore them.
Now, how do you set all this up?
The point of this post is to challenge you to step outside ] your data comfort zone. While tools such as Google Analytics can take you some of the way, you might need to look for data in other places.
At 99designs we have a pretty complicated data configuration. You won’t need anything near this level, — but here are some basic tools that can help take your analytics beyond Google.
We use Segment as the central point for collecting events and distributing them to the various tools that use them.
We then use Indicative as our reporting tool for all that wonderful event data. But it’s not cheap, and alternatives such as Mixpanel offer better entry-level plans.
Setting up your new analytics might feel impossible at first. But try not to get too bogged down. A specialist can help set it all up for you.
Instead, focus on figuring out the questions that are important to your business. Start with your North Star Metric and work downward. Once you can describe the questions you are trying to answer with confidence, it’s easy and affordable to get help setting up the analytics you need.
Love over metrics? Nope, love and metrics.
During the Mastermind event, I was fortunate to spend some time chatting with one of the most authentic community builders online, Jadah Sellner. Her session was titled “Love Over Metrics,” which proposed a slightly different direction than the one I was heading at the event.
But as Jadah and I chatted I realised that although we started at different places, we had common middle ground. We both believe that while meaningfulness is in the value you give to your audience, it’s also important to align how you measure yourself to these goals. Results driven from loving your readers can live right next to a love of data.
This post doesn’t have all the answers. But I hope it helps you understand that there’s a life beyond those headline stats we’ve clung to for so long.
Mastering these measures may not give you schoolyard bragging rights with big headline numbers. But it will give you a better chance of building that profitable blog you always dreamed you could.
Shayne has been part of the ProBlogger Team in various ways for more than a decade – from dreaming up new ProBlogger and Digital Photography School products and running marketing to writing books and speaking at events. These days he’s happy sharing his experiences running teams of amazing content creators, marketers and engineers at 99designs.
The post Blog Metrics: Why You Need to Stop Focusing on ‘Vanity’ Stats appeared first on ProBlogger.
Source: ProBlogger